
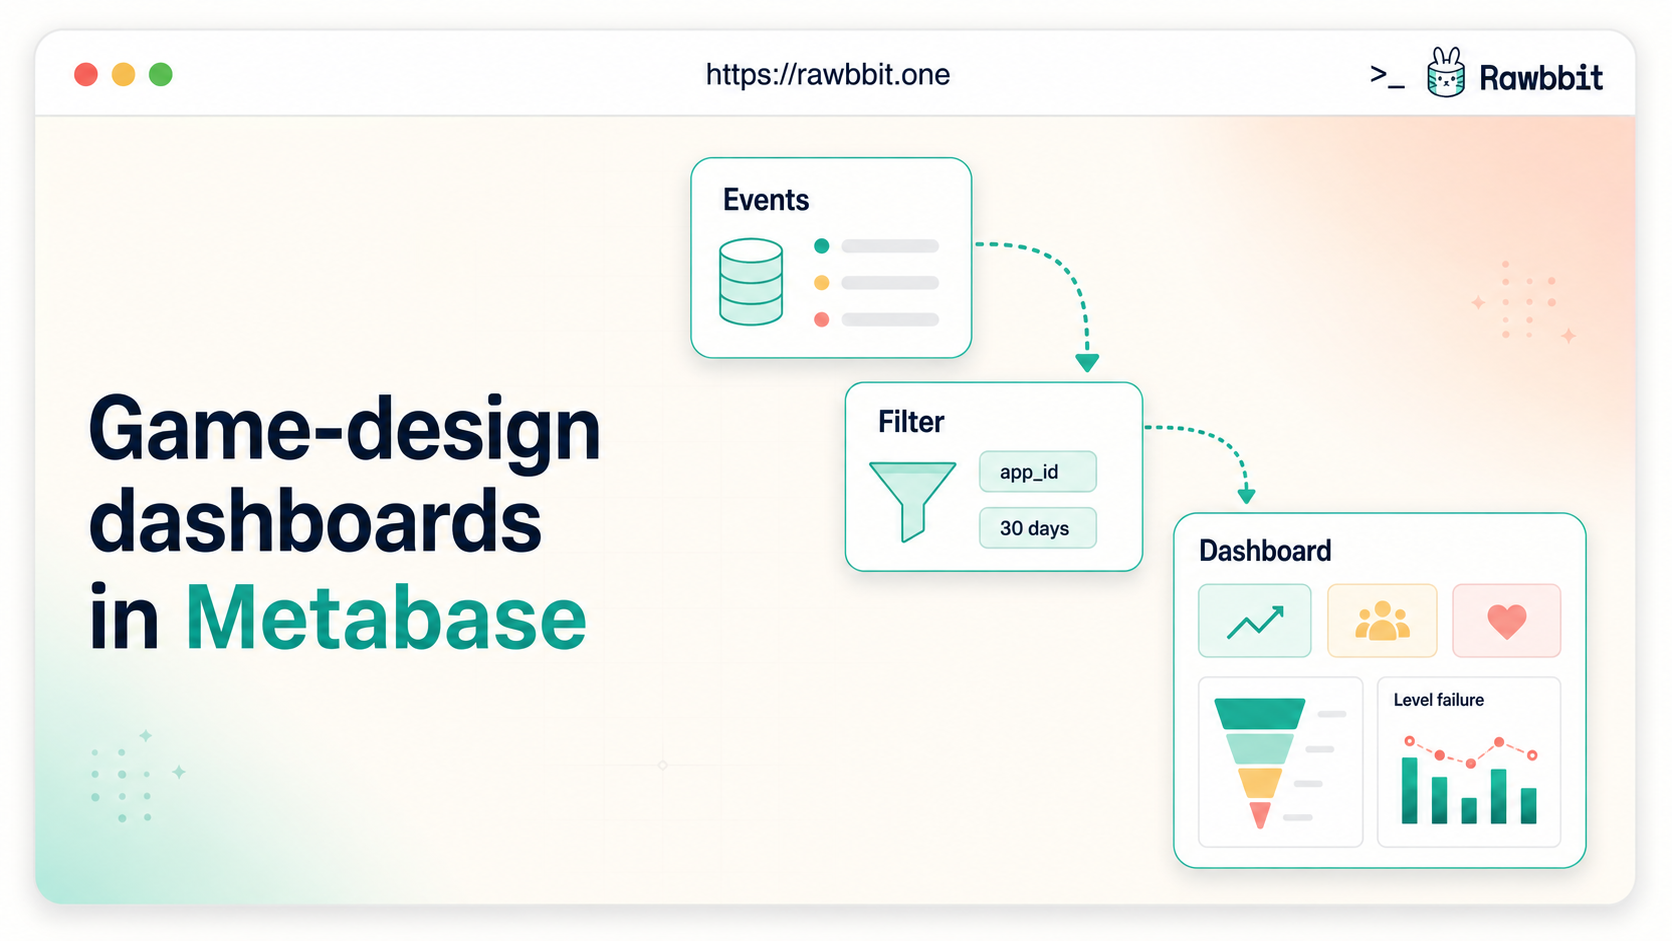
Rawbbit can deliver game events to ClickHouse and connect Metabase to that data. Metabase starts empty: it does not come with a prebuilt dashboard already prepared for your game.
This article shows how to turn that empty Metabase instance into a small dashboard for game designers and live-ops. We will create charts for game health, the path into a level, difficult levels, and experiments.
The screenshots are examples made with synthetic match-3 data. They show what these charts can look like. They are not a dashboard included with Rawbbit, and the numbers are not results from a customer.
You can build the charts yourself, ask an AI agent to prepare the SQL, or ask us to help define the metrics and design and build the dashboard for your game. That help is a separately scoped service, not an automatically included deliverable.
Before creating a chart
This guide assumes:
- Rawbbit is already receiving events from your game
- those events are available in the ClickHouse table
analytics.events - Metabase is connected to ClickHouse
If the events are not arriving yet, start with How Rawbbit works. Metabase cannot create a metric from an event that was never collected.
You also need to know the app_id used by your game. Every query below contains:
WHERE app_id = 'your.game'
Replace your.game with the real value for your game.
Create the dashboard
In Metabase, create a dashboard and give it a practical name such as Game health or Live-ops overview.
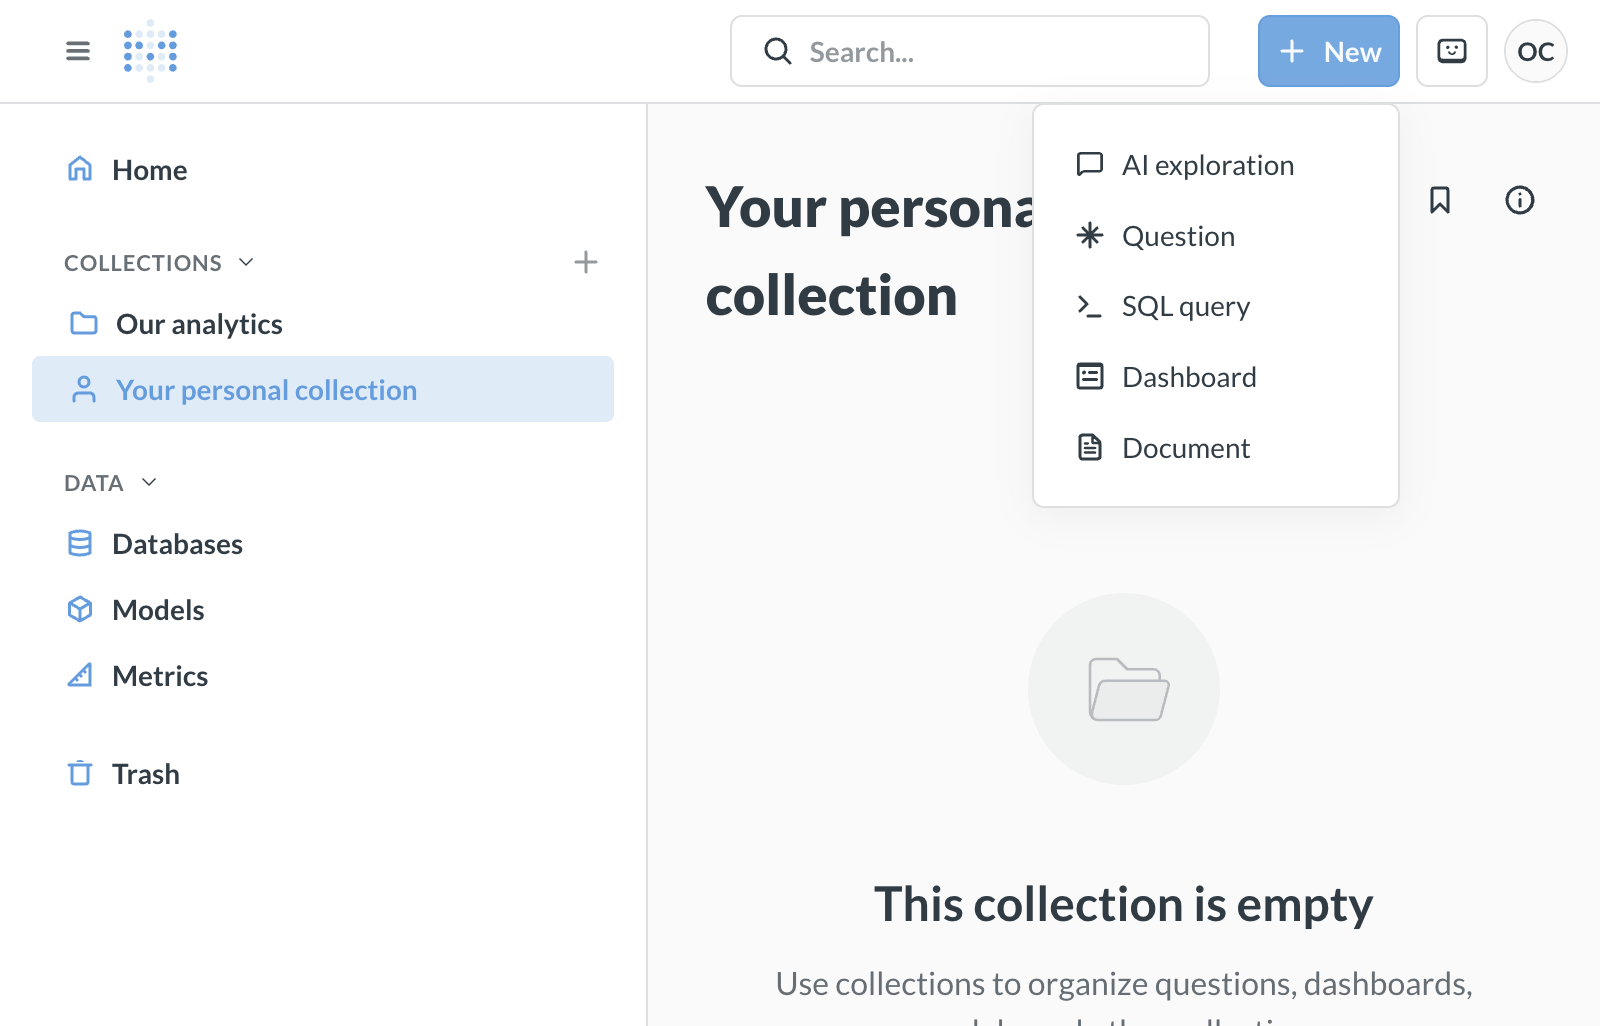
Start from the collection where your team keeps analytics work. Select New in the top-right corner, then choose Dashboard.
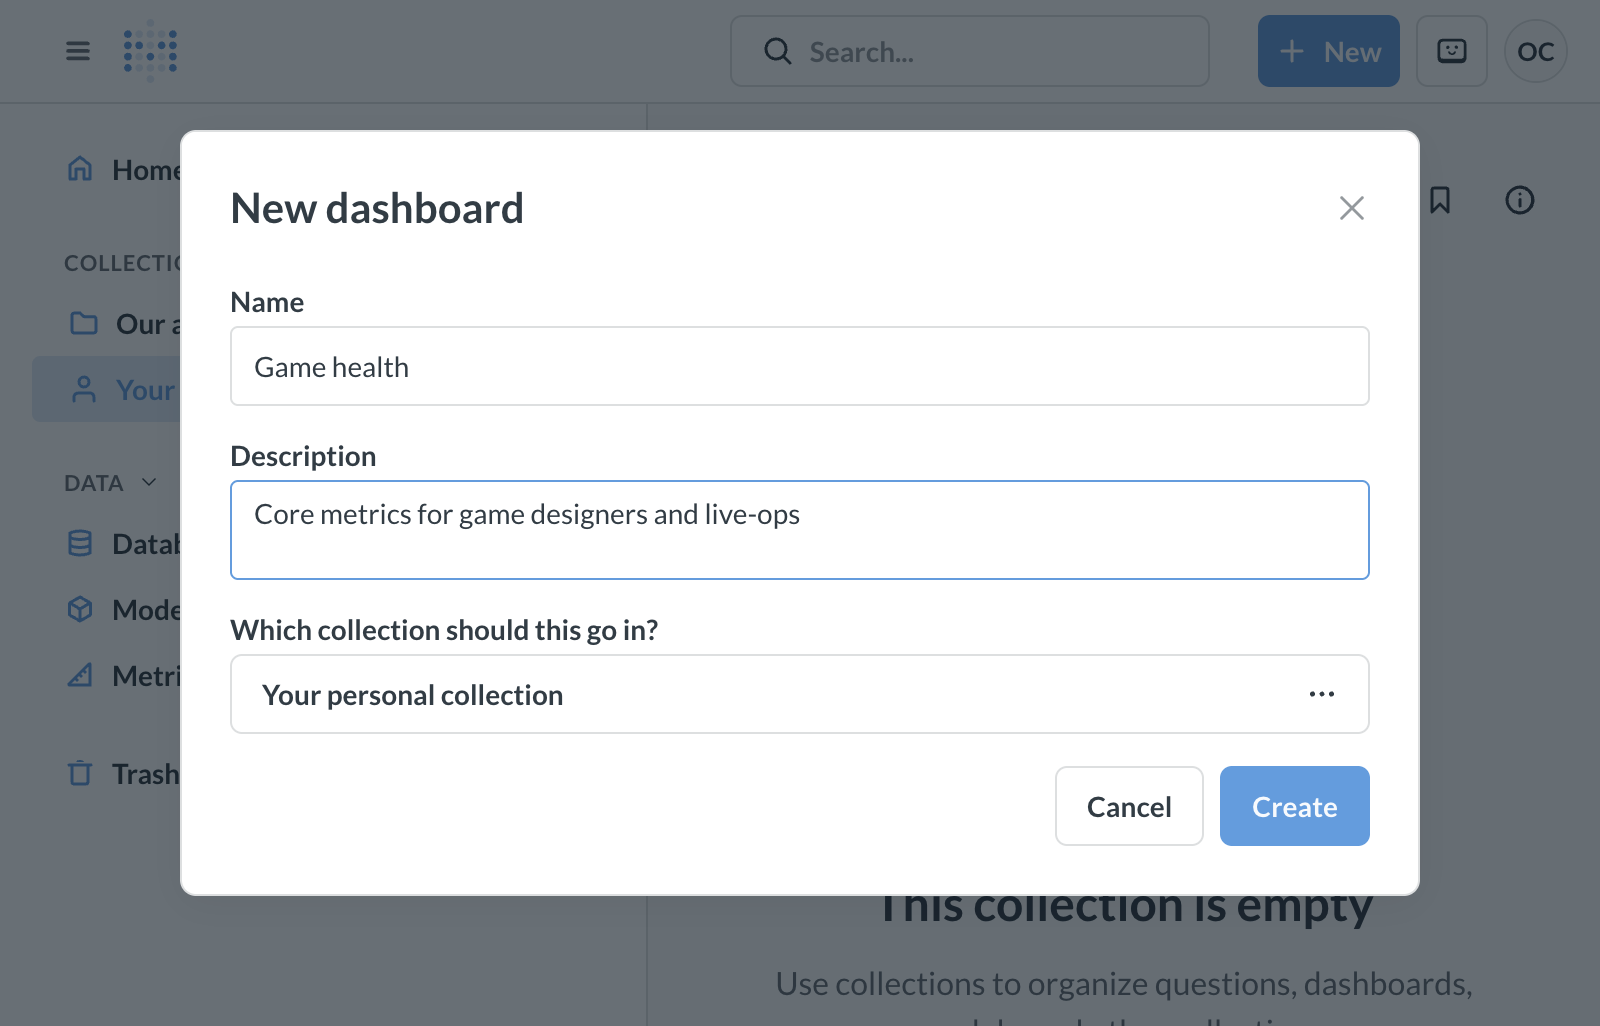
Enter a name, add a short description if it helps your team, choose the collection, and select Create. Creating the dashboard does not create any metrics yet. It gives you a place to add saved questions.
Do not try to build every possible metric at once. A useful first version needs only a few trusted answers:
- How many players and sessions do we have?
- How many levels are started, completed, and failed?
- Where do players stop before completing a level?
- Which levels have unusual failure or retry rates?
Economy and experiment charts can come later, when you know those events and parameters are present.
Check which events are available
Before writing a metric, check what the game actually sends.
For a simple no-SQL check:
- Select New → Question.
- Choose the
analytics.eventstable. - Filter by your
app_idand a recent date range. - Summarize by Count of rows.
- Group by Event Name.
- Show the result as a table and save it.
The filter section should now show the game, environment, and date range. Under Summarize, use Count and group by Event Name.
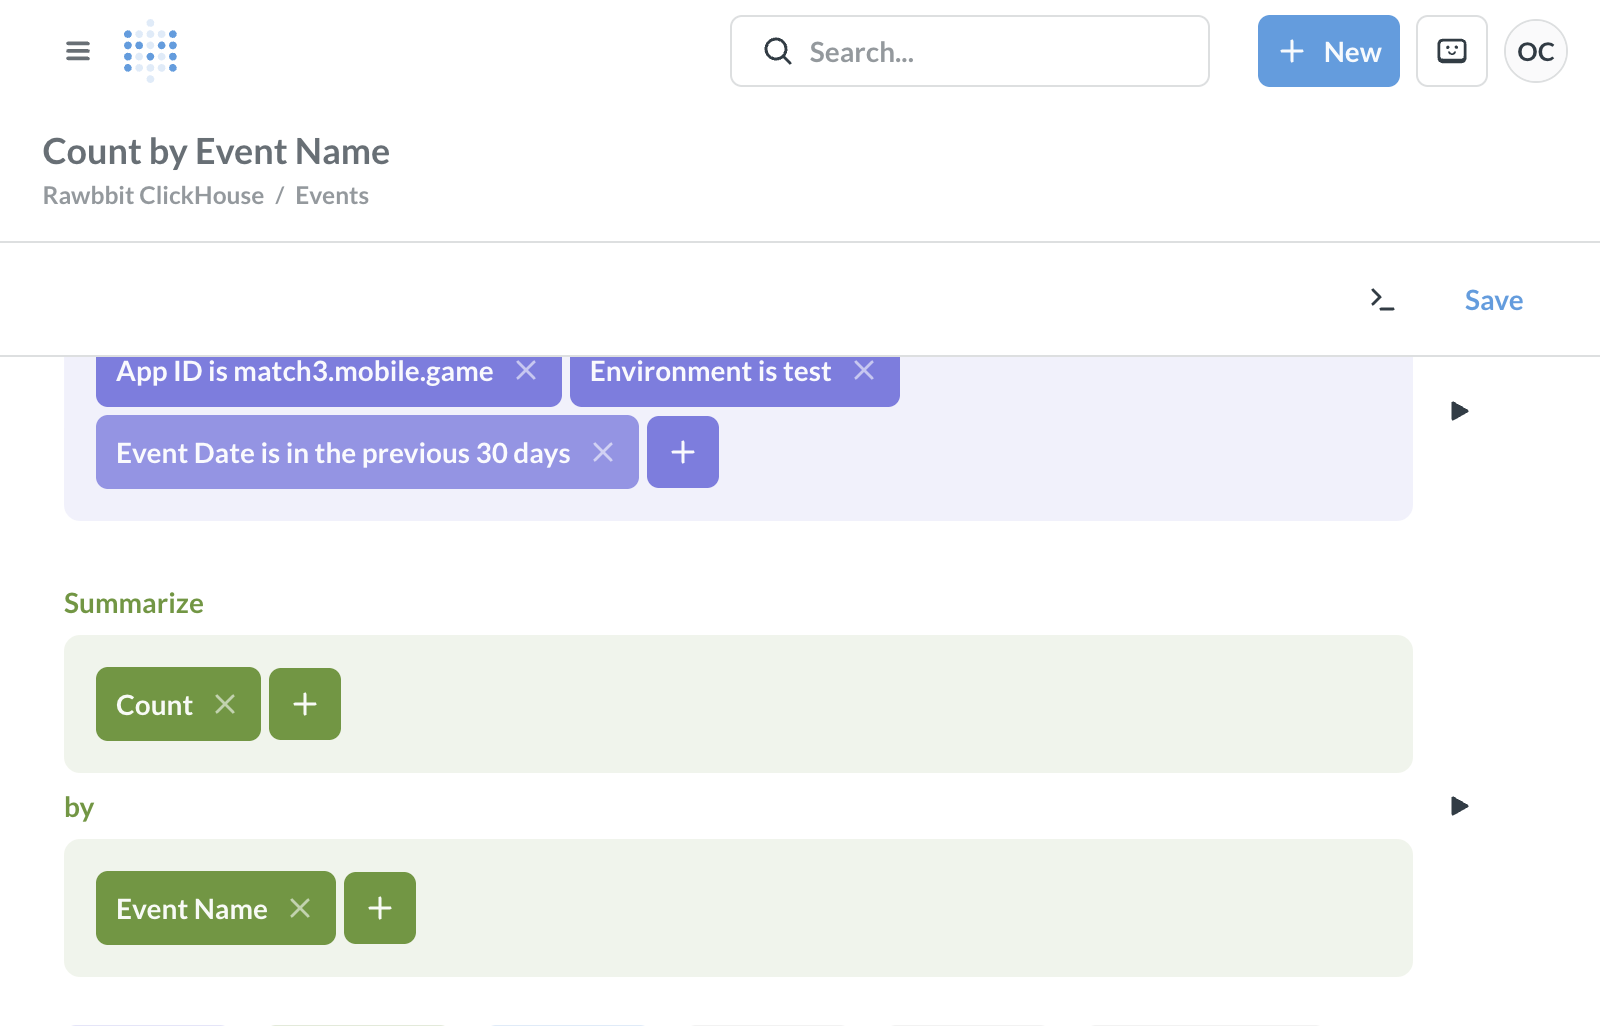
Select Visualize to run the question. The result should be a list of event names and their counts. Keep it as a table, or choose another visualization from the picker at the lower left.
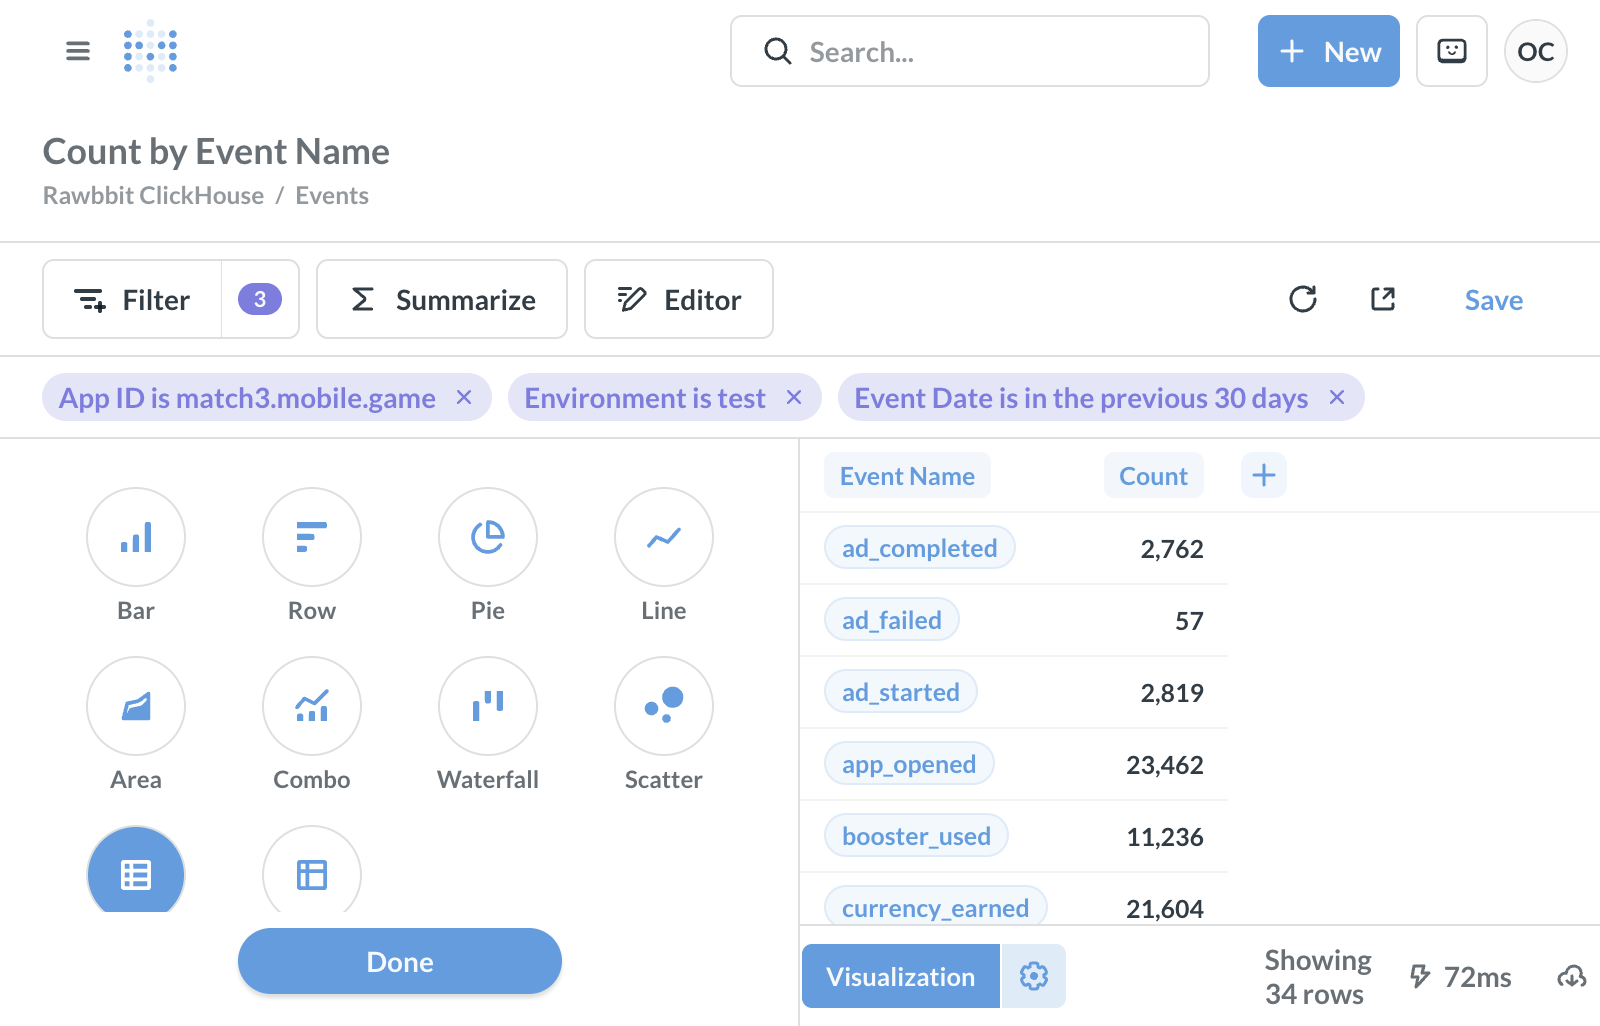
The exact labels can differ slightly between Metabase versions.
You can also use a SQL question:
SELECT
  event_name,
  count() AS events
FROM analytics.events
WHERE app_id = 'your.game'
  AND event_date >= today() - 30
GROUP BY event_name
ORDER BY events DESC
LIMIT 50
The SQL editor keeps the query above the result table. Run the query, inspect the first rows, then use Save if the output is correct.
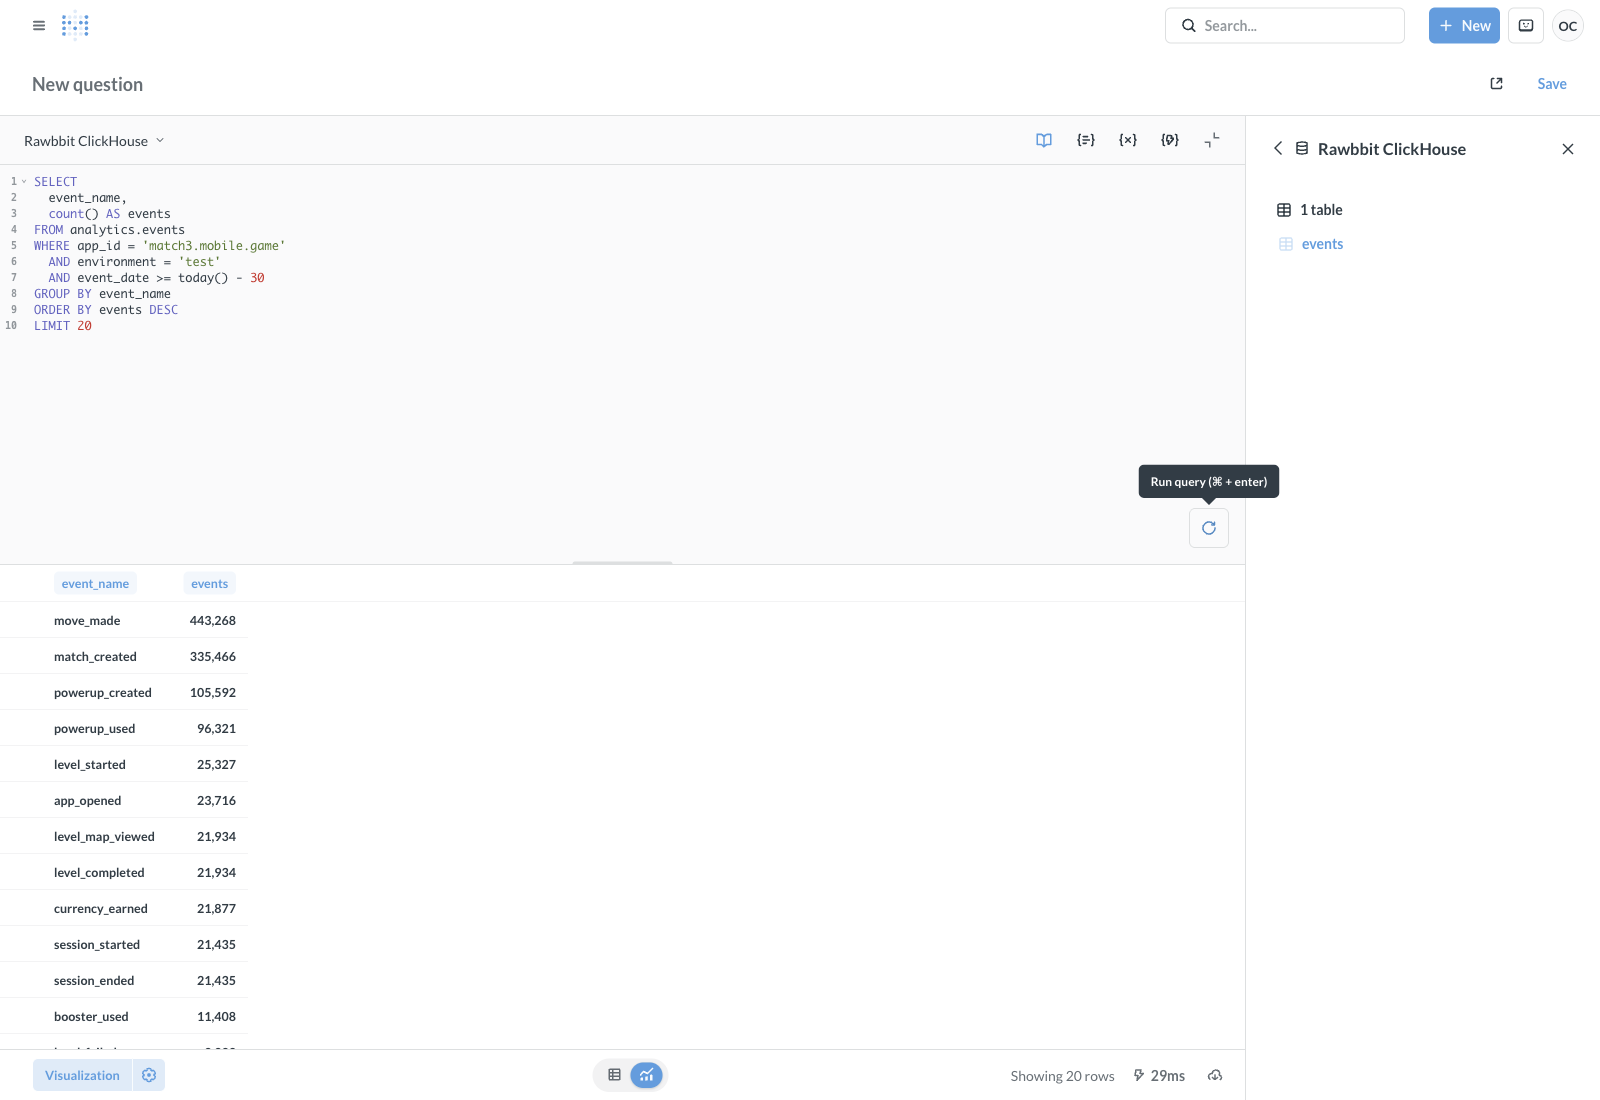
Rawbbit ClickHouse database.If you expect level_failed but it is not in this list, stop here and check the tracking implementation. Renaming a chart will not repair a missing event.
The repeated Metabase workflow
The chart examples below use the same workflow:
- Select New → SQL query.
- Choose the ClickHouse database connected to Rawbbit.
- Paste the query and replace
your.game. - Run it and inspect the rows before choosing a visualization.
- Select a table, line, bar, or funnel visualization.
- Save the question.
- Add the saved question to your dashboard.
The screenshots use Rawbbit ClickHouse as the reader-facing database label; the deployed label in a studio's Metabase may differ.
To arrange the finished cards, open the dashboard and select Edit dashboard. The toolbar at the top lets you add saved questions, headings or text, links, sections, and dashboard-level filters. Drag cards to change their order and size, then select Save.
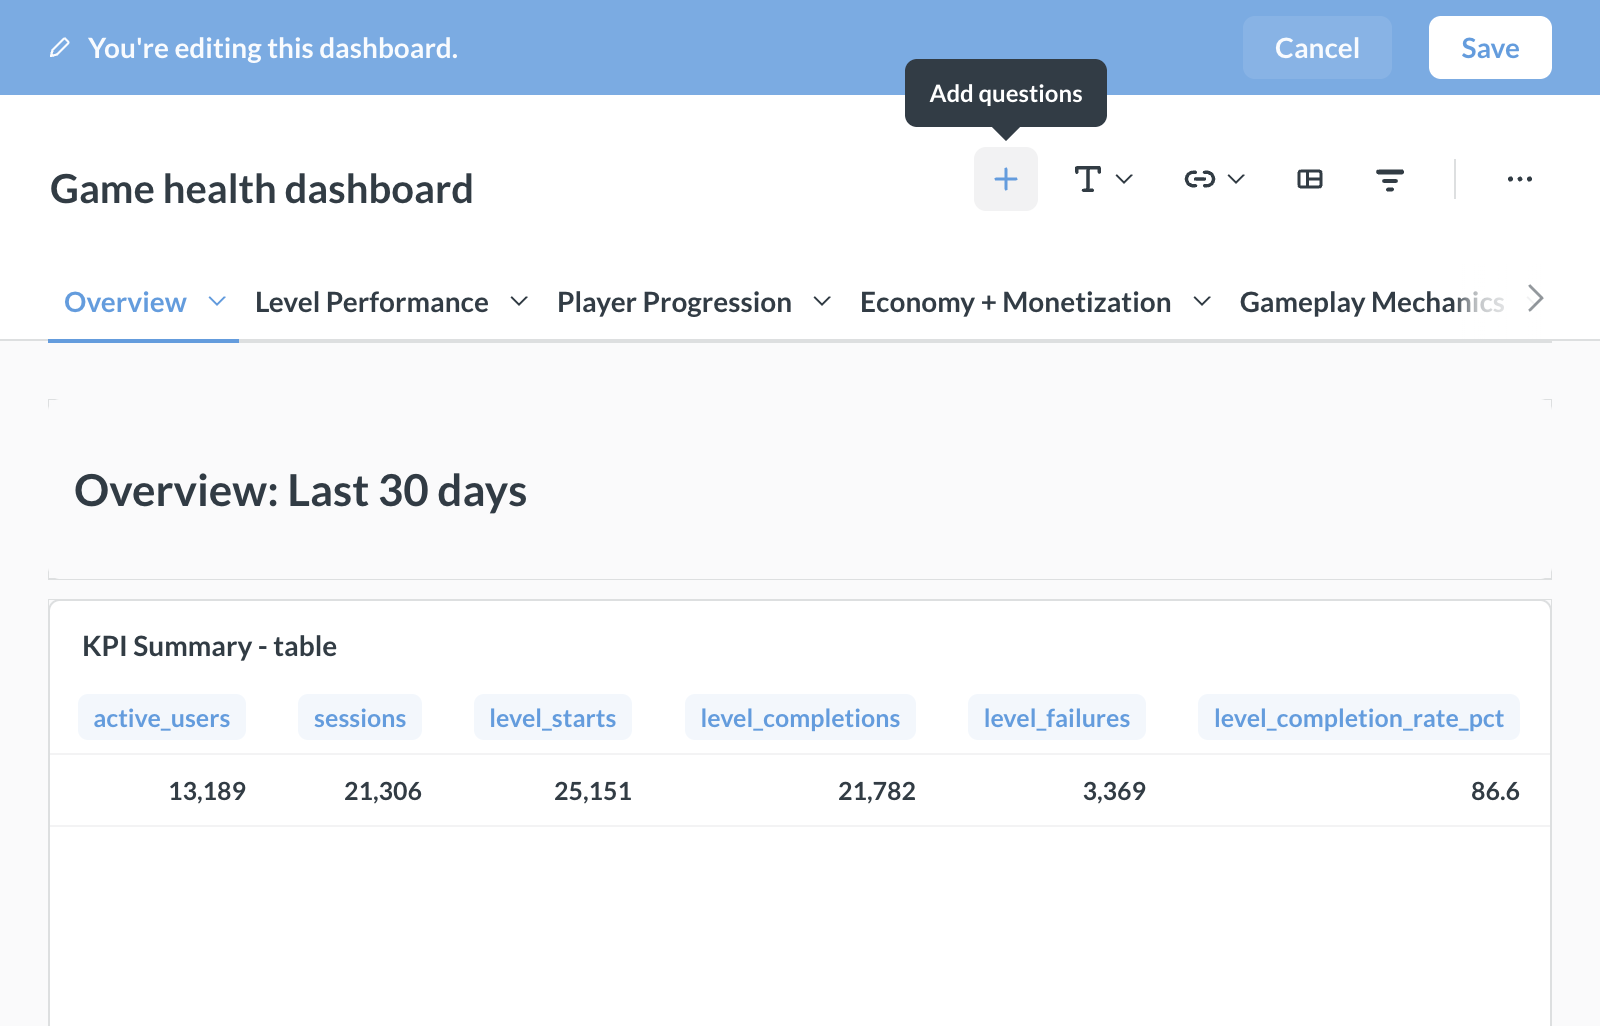
If the result is empty, first check the app_id, date range, event names, and JSON parameter names. An empty result is usually a data mismatch, not a visualization problem.
The chart screenshots below are also synthetic examples. They may show expanded versions of the baseline queries: the baseline SQL does not itself produce the funnel percentage series, the difficult-level completion and duration columns, or the experiment failure, purchase, and revenue columns visible in some screenshots. Treat those extra fields as illustrative and add them only after verifying the event schema and metric definition for your game.
Chart 1: a small game-health summary
Start with one row for the last 30 days: active players, sessions, level starts, completions, and failures.

SELECT
  uniqExact(user_pseudo_id) AS active_players,
  uniqExactIf(session_id, session_id IS NOT NULL) AS sessions,
  countIf(event_name = 'level_started') AS level_starts,
  countIf(event_name = 'level_completed') AS level_completions,
  countIf(event_name = 'level_failed') AS level_failures,
  round(
    100 * countIf(event_name = 'level_completed')
    / nullIf(countIf(event_name = 'level_started'), 0),
    2
  ) AS completion_pct
FROM analytics.events
WHERE app_id = 'your.game'
  AND event_date >= today() - 30
Display this as a table. It is a quick health check, not a finance report and not a retention calculation.
The completion percentage here is completions divided by starts during the selected period. It is useful for monitoring, but it does not follow a player cohort over time.
Purchases and revenue can be added only if the game sends a purchase event and a consistent price parameter. If payment data lives in another database, it must be joined before it can appear reliably in this card.
Chart 2: the path from opening the game to completing a level
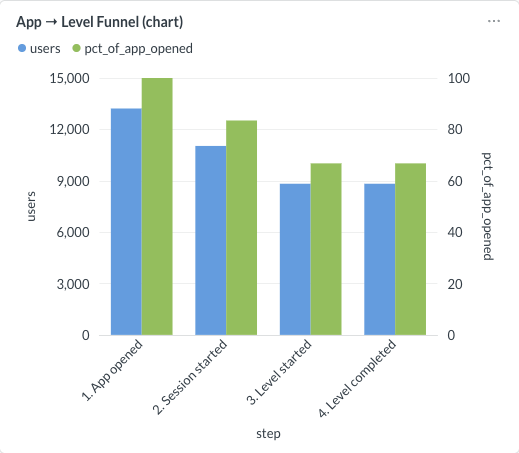
A short funnel helps separate an onboarding problem from a level-difficulty problem.
SELECT
  step,
  step_order,
  users
FROM
(
  SELECT 'App opened' AS step, 1 AS step_order,
    uniqExactIf(user_pseudo_id, event_name = 'app_opened') AS users
  FROM analytics.events
  WHERE app_id = 'your.game' AND event_date >= today() - 30

  UNION ALL

  SELECT 'Session started', 2,
    uniqExactIf(user_pseudo_id, event_name = 'session_started')
  FROM analytics.events
  WHERE app_id = 'your.game' AND event_date >= today() - 30

  UNION ALL

  SELECT 'Level started', 3,
    uniqExactIf(user_pseudo_id, event_name = 'level_started')
  FROM analytics.events
  WHERE app_id = 'your.game' AND event_date >= today() - 30

  UNION ALL

  SELECT 'Level completed', 4,
    uniqExactIf(user_pseudo_id, event_name = 'level_completed')
  FROM analytics.events
  WHERE app_id = 'your.game' AND event_date >= today() - 30
)
ORDER BY step_order
Use step as the category and users as the value. A bar chart works on every Metabase installation; use a funnel visualization if it is available.
This is a simple period funnel: it counts players who generated each event during the last 30 days. It does not prove that every player completed the steps in that exact order. A strict ordered funnel needs session or sequence logic.
If the largest drop is between app open and level start, investigate onboarding and tracking before changing level balance. If players start levels but rarely complete them, level difficulty becomes the stronger question.
Chart 3: levels with high failure or retry rates
For a level-based game, this is usually the most useful designer view.
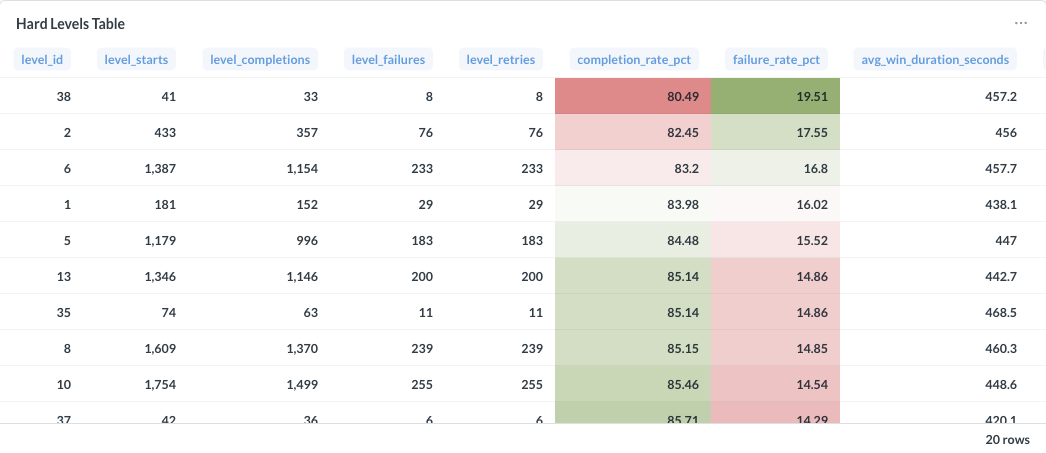
In Rawbbit's base events table, game-specific parameters are stored in event_params_json. In this example the key is level_id:
SELECT
  JSONExtractString(ifNull(event_params_json, '{}'), 'level_id') AS level_id,
  countIf(event_name = 'level_started') AS starts,
  countIf(event_name = 'level_completed') AS completions,
  countIf(event_name = 'level_failed') AS failures,
  countIf(event_name = 'level_retried') AS retries,
  round(
    100 * countIf(event_name = 'level_failed')
    / nullIf(countIf(event_name = 'level_started'), 0),
    2
  ) AS failure_rate_pct
FROM analytics.events
WHERE app_id = 'your.game'
  AND event_name IN (
    'level_started',
    'level_completed',
    'level_failed',
    'level_retried'
  )
  AND event_date >= today() - 30
GROUP BY level_id
HAVING level_id != '' AND starts >= 20
ORDER BY failure_rate_pct DESC
LIMIT 50
Display this as a table. The starts >= 20 condition removes rows where the sample is too small to be useful; choose a threshold that fits your traffic.
Do not rank levels by failure percentage alone. A level with 5 starts and 2 failures looks worse than a level with 2,000 starts and 300 failures, but it is much weaker evidence.
The same data can be displayed as a line or bar chart:
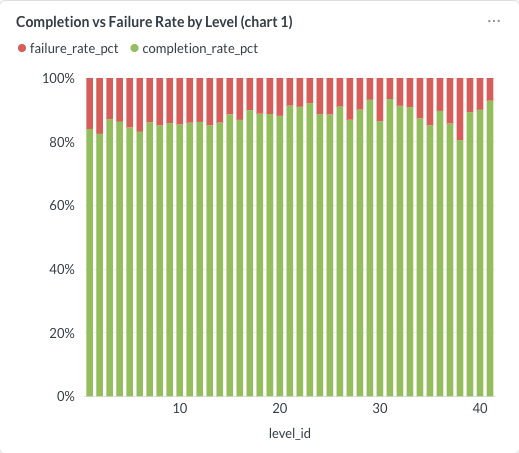
Use level_id on the horizontal axis and rate columns as series. If a level stands out, return to the table and inspect its starts and retries before deciding to rebalance it.
If your game calls the parameter stage_id, mission_id, or something else, replace level_id in the query. Do not guess the key.
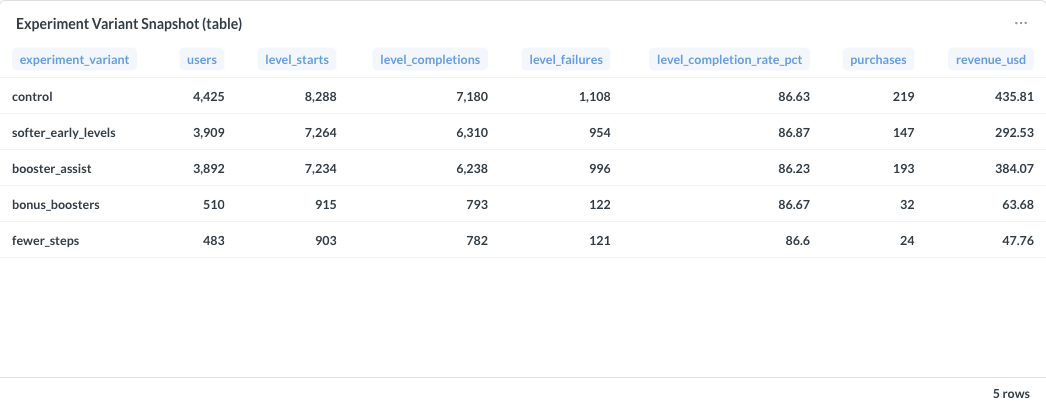
Chart 4: results by experiment variant
Build this only if your events contain an experiment identifier or variant.
SELECT
  JSONExtractString(
    ifNull(event_params_json, '{}'),
    'experiment_variant'
  ) AS experiment_variant,
  uniqExact(user_pseudo_id) AS players,
  countIf(event_name = 'level_started') AS level_starts,
  countIf(event_name = 'level_completed') AS level_completions,
  round(
    100 * countIf(event_name = 'level_completed')
    / nullIf(countIf(event_name = 'level_started'), 0),
    2
  ) AS completion_pct
FROM analytics.events
WHERE app_id = 'your.game'
  AND event_date >= today() - 30
GROUP BY experiment_variant
HAVING experiment_variant != ''
ORDER BY players DESC
Display this as a table. Always keep the player count beside the result. A variant with a small sample should not drive a release decision.
For a real experiment analysis, also filter by the experiment ID and confirm how players are assigned to variants. Otherwise two experiments using the same variant names can be mixed together.
Ask an agent to prepare the SQL
A game designer does not need to write these queries from memory. An AI agent connected to Rawbbit through MCP can inspect available event names and prepare a query for Metabase.
For example:
Use the ClickHouse table
analytics.events. For our game and the last 30 days, prepare a Metabase query that shows level starts, failures, retries, and failure rate by level. First inspect our event names and a sample ofevent_params_json. Do not invent events or parameter keys. Return the SQL and explain what each row means.
Then:
- Paste the query into Metabase.
- Run it as a table first.
- Compare a few rows with events or a metric you already trust.
- Only then choose a visualization and add it to the dashboard.
The agent removes the need to remember SQL syntax. It does not remove the need to verify event names, parameter meanings, and the result.
See How to connect Rawbbit MCP to Codex for the connection setup.
What Metabase cannot repair
Metabase can visualize the data it receives. It cannot repair:
- events that were never sent
- event names that change between game versions
- missing or inconsistent
level_idvalues - experiment variants assigned inconsistently
- purchase data stored elsewhere without a join
When a chart suddenly becomes empty, check the latest event names and parameters before changing the chart.
A reasonable first dashboard
Start with three trusted cards:
- game-health summary
- app-to-level funnel
- difficult-levels table
Add experiment, economy, ads, or progression views after the required events are verified. A small dashboard that answers real questions is more useful than twenty cards nobody trusts.
If your team does not want to build this itself, we can help define the metrics, prepare the SQL, and build the first Metabase dashboards around your game's events as a separately scoped service.